Class 1
Data member
Data member
Class 2
Data member
Data member
Class 3
Data member
Data member
maps to
OLAP Server
SQL Server
The Commerce Server 2000 Data Warehouse is a set of processes that a system administrator uses to import and maintain data in a combination of a SQL Server database, and an Online Analytical Processing (OLAP) database. The Data Warehouse imports a large amount of site usage data collected from different data sources. This data is gathered from your Web server logs, the Commerce Server databases (profiles, catalogs, campaigns, and transactions) and other data sources that you specify. The Data Warehouse then manages the data in the SQL Server and OLAP databases. These databases are then used to produce reports and to analyze and view population segments.
The Data Warehouse is designed to support robust query and analysis. You use the Analysis modules in Commerce Server Business Desk to analyze the data in the Data Warehouse, for example, to identify user trends or to analyze the effectiveness of a campaign, and then update your site to target content to specific user groups or to sell specific products.
Using the Data Warehouse in Web Site Management
Importing Data into the Data Warehouse
Preparing Data for Analysis with Analysis Services
The Data Warehouse combines data from multiple sources into one common structure, giving the data consistency for producing reports and analyzing and viewing population segments. This is called the Commerce Server Business Analytics System. Business analytics is a way of looking at your Web site data to answer specific questions about the performance of your Web site. You can use the information provided by business analytics to improve your customer service and to target content to users.
Business analytics provides you with specific measurements of your Web site performance, including:
You can use these measurements to make changes to your Web site that will increase sales and retain users. For example, assume you display an advertisement to promote a new product. After the ad is displayed for a week, you can run a report to determine whether the ad increased sales of the product. If it did not increase sales, you can update you site, for example, to display a 10 percent discount for the new product, and then after a week, determine whether the discount improved sales.
The Data Warehouse has two main parts:
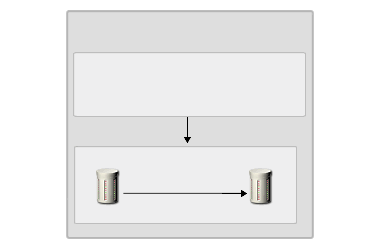
The following figure shows the relationship between the physical store and the logical schema.

Class 1
Data member
Data member
Class 2
Data member
Data member
Class 3
Data member
Data member
maps to
OLAP Server
SQL Server
The physical store for the Data Warehouse includes one database that you can query using SQL queries. The physical store contains all the data that you have imported from different sources.
Commerce Server automatically builds the physical store for the Data Warehouse in both the SQL Server database and in the OLAP database. The Data Warehouse provides the data necessary for all the Commerce Server reports available in the Business Desk Analysis modules.
There is no need for you to directly modify the physical store for the Data Warehouse. If you need to extend the Data Warehouse, for example, to encompass third-party data, a site developer can programmatically add the fields you need through the logical schema.
The logical schema provides an understandable view of the data in the Data Warehouse, and supports an efficient import process. For example, a site developer uses the logical schema to modify the location of data stored in the underlying physical tables. When a site developer writes code to add, update, or delete data in the Data Warehouse, the developer interacts with the logical schema. When Commerce Server accesses data in the Data Warehouse, it accesses the data through the logical schema. Only the site developer needs detailed knowledge of the logical schema.
A logical schema includes the following:
The logical schema uses classes, data members, relations, and other data structures to map data in the physical store.
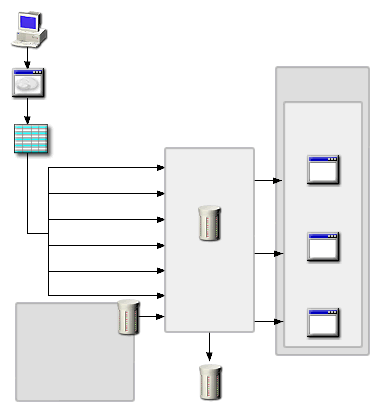
The data that populates the Data Warehouse typically comes from multiple data sources: Web server logs, Commerce Server databases, and other data sources that you specify. The following figure shows the sources for operational data, and how the data might be used to support tasks run from Business Desk.

Because the Data Warehouse is not part of your run-time environment, a system administrator must determine how frequently to import the operational data into the Data Warehouse. For example, you can set up the Data Warehouse so that it automatically imports new data every day or every week. The frequency with which you will need to import data depends on the amount of new data collected every day in your operational data sources. Commerce Server includes custom Data Transformation Service (DTS) tasks that simplify the importing of data into the Data Warehouse. These DTS tasks import data that is used with the reports available from Business Desk.
Even though the operational data can be imported from different types of databases — or from storage media that are not databases — all of the data is structured in a consistent manner after it is gathered into the Data Warehouse. For example, you might have one data source in which the first and last name of a user are stored in the same field, and another in which the first and last names are stored in separate fields. When this data is imported into the Data Warehouse, it is automatically structured to be consistent, thus enabling your analysis activities.
After data is imported into the Data Warehouse SQL Server database, it must be prepared for analysis so business managers can run reports against it. To prepare data for reporting, the system administrator runs a DTS task that exports a selected subset of data from the SQL Server database to the OLAP database. In the OLAP database, the data is stored in multidimensional cubes.
By storing data in OLAP cubes, instead of in relational tables in SQL Server, the Data Warehouse can retrieve data for reporting purposes more quickly. The data can be retrieved from the cubes faster because it is aggregated. That is, data that belongs together is already associated so it is easier to retrieve than searching an entire relational database for the smaller parts. For example, using OLAP server you can run a report that lists users who visit your site based on the time of their visit and on the ASP page that they access first. It would be extremely difficult to run such a report against a large SQL Server database.
In multidimensional cubes, data is grouped in two kinds of structures:
It is the relationship between the dimension (for example, color) and measure (for example, number of products sold) structures that provides the basis for your reports about user activity.
The following figure illustrates the dimensions and measures in a report.

Click the illustration to enlarge or reduce.
To analyze data about user activity on your site, you use the Analysis modules in Business Desk. You can use the Analysis modules to run reports against the Data Warehouse, or to view and analyze Segment models, which identify segments of the user population visiting your site.
Commerce Server provides two types of reports that you can use to analyze user data:
Commerce Server 2000 includes several reports that you can run from Business Desk, such as the Executive Summary Report, the Products by Quantity Sold Report, and the Hits by User Report. You can use one or more of these reports, or you can customize a report to retrieve other data. For a list of reports included with Commerce Server, see Commerce Server Reports.
Segment models identify groups of users who share similar characteristics. You can use the Commerce Server Predictor resource to search the data in the Data Warehouse to generate Segment models. You analyze Segment models using the Segment Viewer module in Business Desk. For conceptual information about Segment models, see Prediction and Data Mining.