Viewing a Segment Model
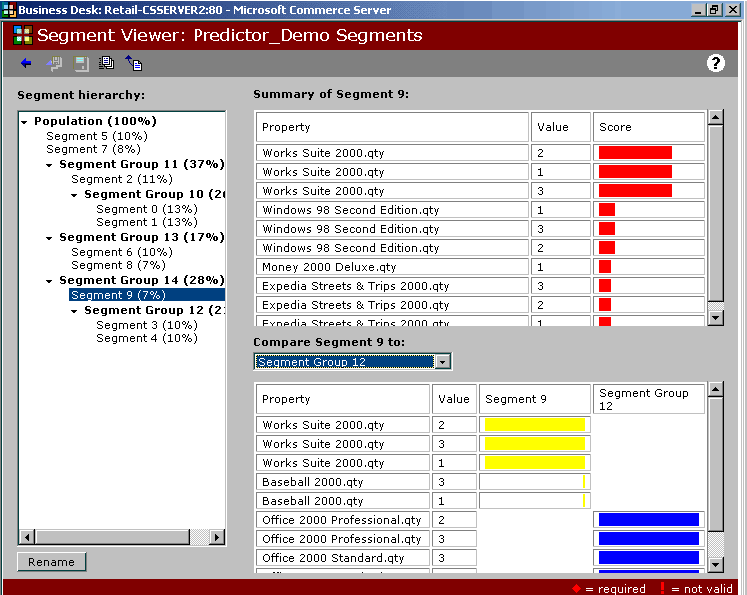
The first time you view a , the and in the Segment hierarchy have generic names, such as Segment1, Segment2, and so on. The percentage of the total population represented in a segment or segment group appears in parentheses after the name. The segment summary appears on the screen to the right of the segment list.

Click the illustration to enlarge or reduce.
The summary of your segment or segment group contains a table with the following columns:
- / pairs. Correspond to each other and best summarize the records in the selected segment or segment group. For example, if the majority of records in a given segment correspond to people whose occupation is "Student," then "Occupation" appears in the Property column and "Student" appears in the Value column.
- . Displays a red bar, the length of which is a relative indicator of how well the matching property/value pair summarizes the records in the selected segment or segment group.
To view a Segment model
- Click Segment Viewer, select the Segment model you want to view, and then click
 on the toolbar.
The Segment Viewer screen appears with the top-level segment group, which is labeled Population (100%), visible. To view lower-level segments and segment groups, click the arrow next to the top-level segment group.
 Note
Note
- You can view only one Segment model at a time.
Your system administrator creates Segment models in Commerce Server Manager. For information about creating Segment models, see "Running the Predictor Resource" in Commerce Server 2000 Help.
See Also
Workflow for Segment Analysis
Segment Viewer
Commerce Server Reports
Copyright © 1996–2000 Microsoft Corporation.
All rights reserved.


![]() Note
Note